Estimated Fees in India
₹ 0 to ₹ 800 per hour
Find CFA Coaching classes Fees in your locality

12 year of experience in home tutions

I am a recent MBA graduate from Oxford University. I am highly motivated and passionate about tutoring. I have been working as a professional tutor for the last 3 years. "Your Results" matter to me more than anything else. If you want to succeed, then connect with me ASAP. All my students till date have achieved.

Total work experience of over 10 years in the financial services industry.


Post your Learning Need

Get customized quotes and responses from Tutors

Choose & Learn from Tutor of your choice

No data available

No data available

No data available

No data available

No data available

No data available
Lesson Posted on 10/02/2018 Learn Exam Coaching/CMA Coaching

CPACMA Coach
LetsLearn is the national body which champions teaching excellence. We work wit universities,coporates...
i. Break Even Point: The break–even point (BEP) or break–evenlevel represents the sales amount in either unit (quantity) or revenue (sales) terms that is required to cover total costs, consisting of both fixed and variable costs to the company. Total profit at the break-even point is zero.
ii. Expense Behavior: At the heart of break-even point or break-even analysis is the relationship between expenses and revenues. It is critical to know how expenses will change as sales increase or decrease. Some expenses will increase as sales increase, whereas some expenses will not change as sales increase or decrease.
a. Variable Expenses: Variable expenses increase when sales increase. They also decrease when sales decrease.
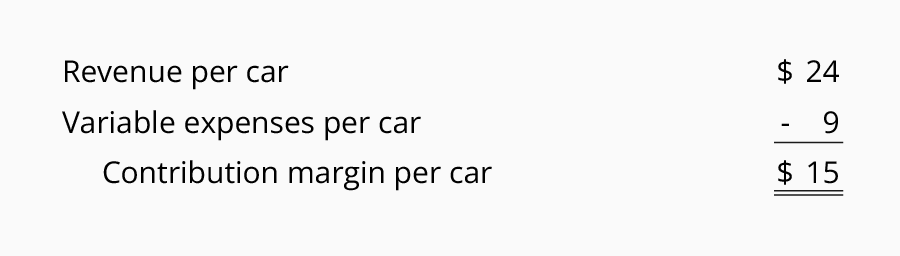
At Oil Change Co. the following items have been identified as variable expenses. Next to each item is the variable expense per car or per oil change:
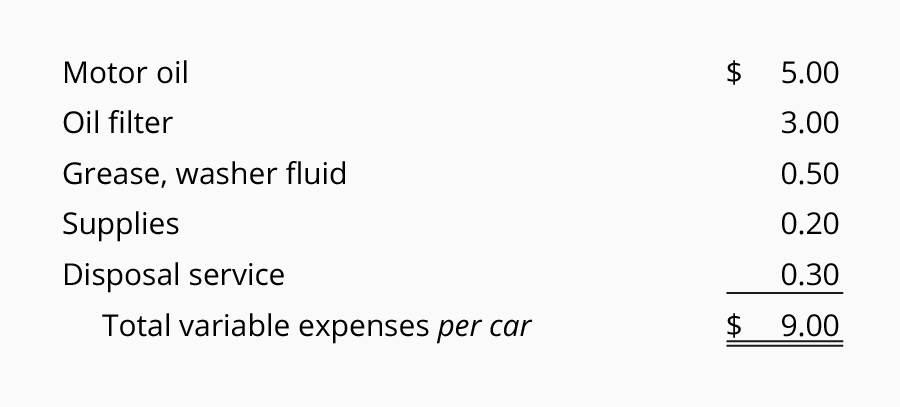
The other expenses at Oil Change Co. (rent, heat, etc.) will not increase when an additional car is serviced.
For the reasons shown in the above list, Oil Change Co.’s variable expenses will be $9 if it services one car, $18 if it services two cars, $90 if it services 10 cars, $900 if it services 100 cars, etc.
b. Fixed Expenses: Fixed expenses do not increase when sales increase. Fixed expenses do not decrease when sales decrease. In other words, fixed expenses such as rent will not change when sales increase or decrease.
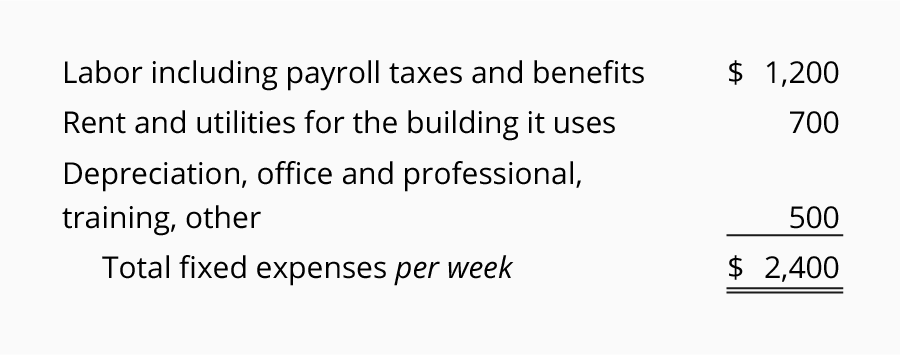
At Oil Change Co. the following items have been identified as fixed expenses. The amount shown is the fixed expense per week:
c. Mixed Expenses: Some expenses are part variable and part fixed. These are often referred to as mixed or semi-variable expenses. An example would be a salesperson’s compensation that is composed of a salary portion (fixed expense) and a commission portion (variable expense). Mixed expenses could be split into two parts. The variable portion can be listed with other variable expenses and the fixed portion can be included with the other fixed expenses.
iii. Revenues or Sales: Revenues (or sales) at Oil Change Co. are the amounts earned from servicing cars. Oil Change Co. charges one flat fee of $24 for performing the oil change service. For $24 the company changes the oil and filter, adds needed fluids, adds air to the tires, and inspects engine belts.
At the present time no other service is provided and the $24 fee is the same for all automobiles regardless of engine size.
As the result of its pricing, if Oil Change Co. services 10 cars its revenues (or sales) are $240. If it services 100 cars, its revenues will be $2,400.
iv. Desired Profit In Units Let’s say that the owner of Oil Change Co. needs to earn a profit of $1,200 per week rather than merely breaking even. You can consider the owner’s required profit of $1,200 per week as another fixed expense. In other words the fixed expenses will now be $3,600 per week (the $2,400 listed earlier plus the required $1,200 for the owner). The new point needed to earn $1,200 per week is shown by the following break-even formula:

Always check your calculations:
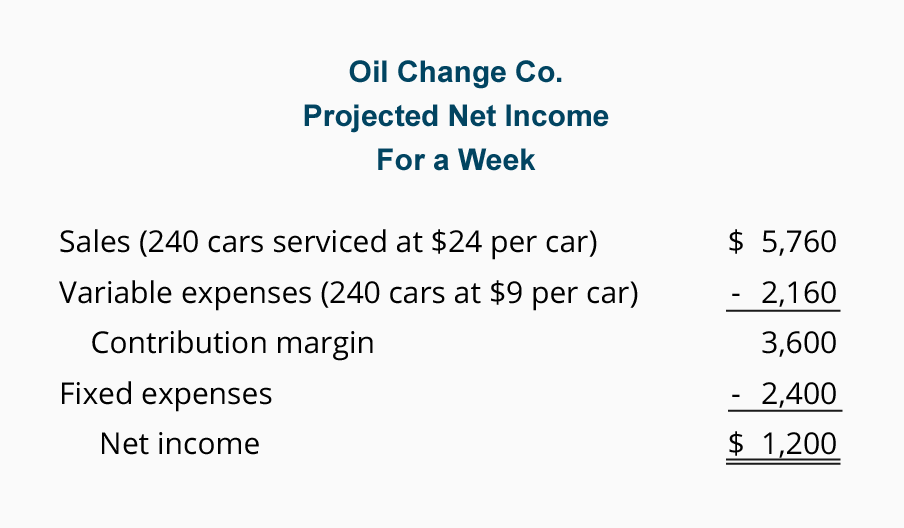
The above schedule confirms that servicing 240 cars during a week will result in the required $1,200 profit for the week.
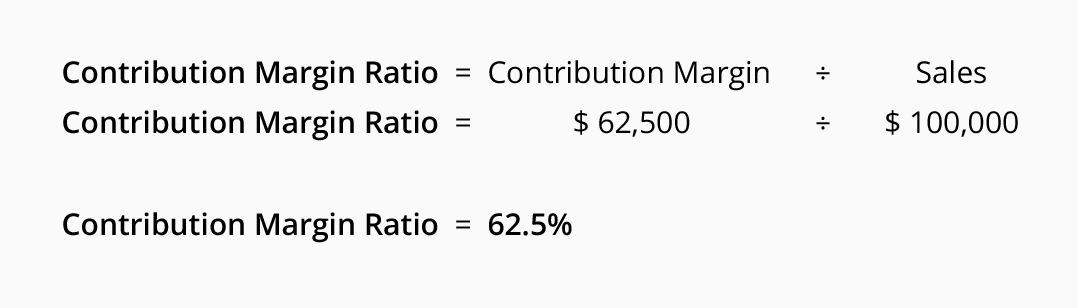
v. Break-even Point In Sales Dollars: One can determine the break-even point in sales dollars (instead of units) by dividing the company’s total fixed expenses by the contribution margin ratio.
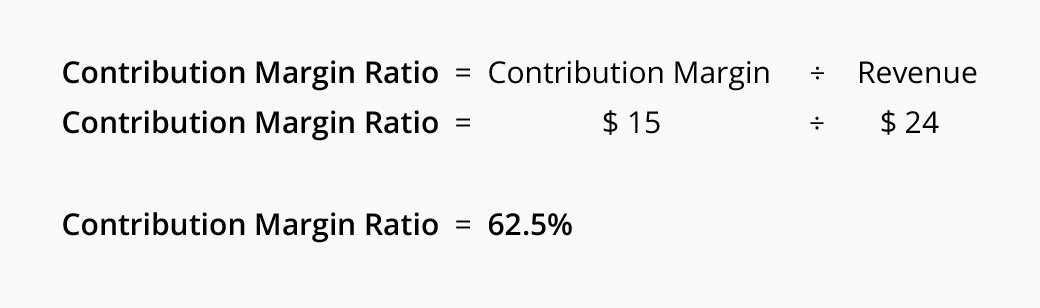
The contribution margin ratio is the contribution margin divided by sales (revenues). The ratio can be calculated using company totals or per unit amounts. We will compute the contribution margin ratio for the Oil Change Co. by using its per unit amounts:
The break-even point in sales dollars for Oil Change Co. is:
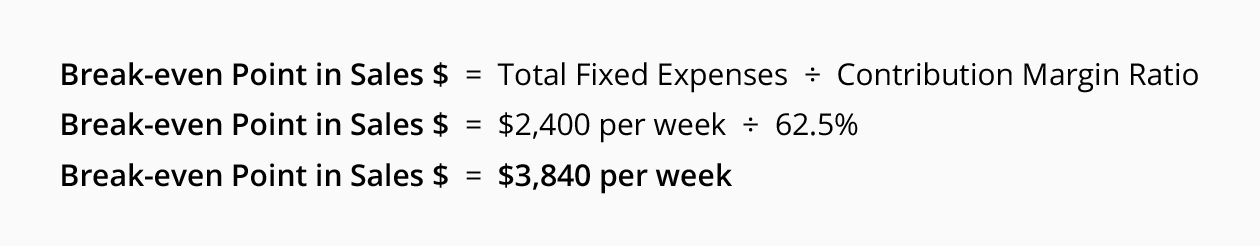
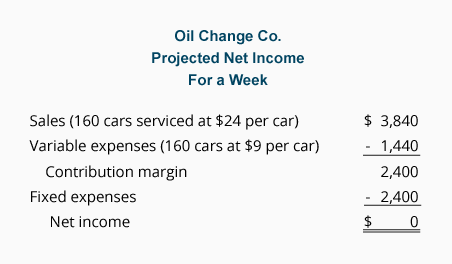
The break-even point of $3,840 of sales per week can be verified by referring back to the break-even point in units. Recall there were 160 units necessary to break-even. At $24 per unit the necessary sales in dollars would be $3,840.
vi. Desired Profit In Sales Dollars: Let’s assume a company needs to cover $2,400 of fixed expenses each week plus earn $1,200 of profit each week. In essence the company needs to cover the equivalent of $3,600 of fixed expenses each week.
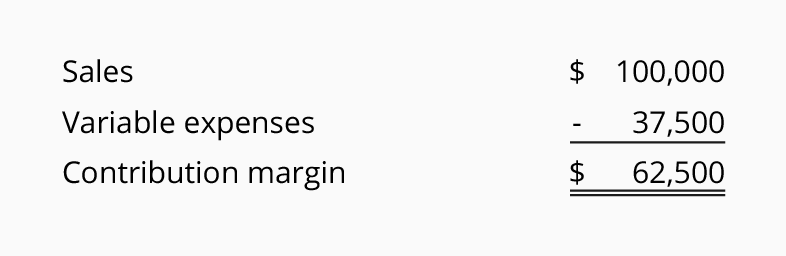
Presently the company has annual sales of $100,000 and its variable expenses amount to $37,500 per year. These two facts result in a contribution margin ratio of 62.5%:
The amount of sales necessary to give the owner a profit of $1,200 per week is determined by this break-even point formula:

To verify that this answer is reasonable, we prepared the following schedule:
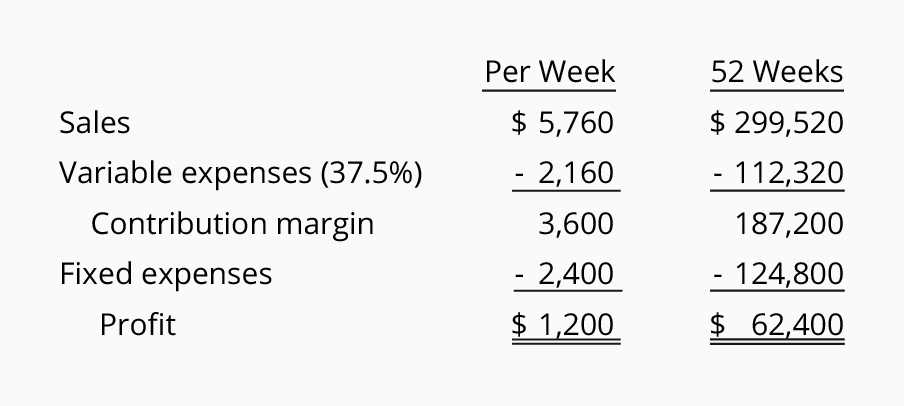
As you can see, for the owner to have a profit of $1,200 per week or $62,400 per year, the company’s annual sales must triple. Presently the annual sales are $100,000 but the sales need to be $299,520 per year in order for the annual profit to be $62,400.
read lessLesson Posted on 26/04/2017 Learn Financial Planning/Risk Management
Value at Risk - Historical Simulation Approach (Buy-and-hold & Constant Mix assumptions)

Nishant Misra
Working in the investment bank in the Market Risk domain from past 2 Years, will be looking to teaching...
One of the most widely used risk measures is the Value at Risk or VaR. VaR summarizes the worst expected loss over a target horizon within a given confidence interval.
Historical Simulation is non-parametric method that utilizes past returns to generate a VaR . It does not require any statistical assumption beyond stationarity of the distribution of returns or, in particular, their volatility. Suppose we have returns from day 1 to day t . To get the v\return of day t , we need to apply the formula:
The value of risk with confidence level p% is calculated as :
VaR = Portfolio Amount*(PERCENTILE(Return(t=1):Return(t=t),(100%-p%)))
Historical Simulation for portfolio is performed in two ways :
When we have daily returns of the each stock in percentage basis, we multiply each stock with the each stocks composition percentage. As per provided above, we need to multiply stock A with 33% and stock B with 67% to maintain constant composition on the daily return.
When we have daily returns of the each stock in percentage basis, we check out how much of the returns it shows on daily basis on the monetary basis, we check how much each stock comprises of total composition as we get varying composition of daily return.
read lessAnswered on 18/09/2016 Learn Exam Coaching/CFA Coaching

Shruti G.
Finance Trainer
Have a question about CFA Coaching classes Fees? Ask your question and get answers from top Tutors.
Create your FREE UrbanPro profile and grow your income!
Find best tutors for CFA Coaching Classes by posting a requirement.

Get started now, by booking a Free Demo Class