
 0
0Flash back from IX Class
A systematic record of facts or different values of a quantity is called data.
Features of the data
- Statistics deals with collection, presentation, analysis and interpretation of numerical data.
- Arranging data in a order to study their salient features is called presentation of data.
- Data arranged in ascending or descending order is called arrayed data or an array
- Range of the data is the difference between the maximum and the minimum values of the observations
- Table that shows the frequency of different values in the given data is called a frequency distribution table
- A frequency distribution table that shows the frequency of each individual value in the given data is called an ungrouped frequency distribution table.
- A table that shows the frequency of groups of values in the given data is called a grouped frequency distribution table
- The groupings used to group the values in given data are called classes or class-intervals. The number of values that each class contains is called the class size or class width. The lower value in a class is called the lower class limit. The higher value in a class is called the upper class limit.
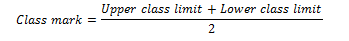
- Class mark of a class is the mid value of the two limits of that class.
- A frequency distribution in which the upper limit of one class differs from the lower limit of the succeeding class is called an Inclusive or discontinuous Frequency Distribution.
- A frequency distribution in which the upper limit of one class coincides from the lower limit of the succeeding class is called an exclusive or continuous Frequency Distribution
Bar Graph:
A bar graph is a pictorial representation of data in which rectangular bars of uniform width are drawn with equal spacing between them on one axis, usually the x axis. The value of the variable is shown on the other axis that is the y axis.
Histogram:
A histogram is a set of adjacent rectangles whose areas are proportional to the frequencies of a given continuous frequency distribution
Mean
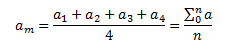
The mean value of a variable is defined as the sum of all the values of the variable divided by the number of values.
Median
The median of a set of data values is the middle value of the data set when it has been arranged in ascending order. That is, from the smallest value to the highest value
Median is calculated as

Where n is the number of values in the data. If the number of values in the data set is even, then the median is the average of the two middle value
Mode
Mode of a statistical data is the value of that variable which has the maximum frequency
Mean for Ungroup Frequency table
| Mark obtained(xi) | 25 | 35 | 45 | 65 |
| No of student(fi) | 4 | 10 | 23 | 34 |
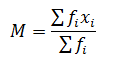
Mean is given by
Mean for group Frequency table
| Class interval | 10-25 | 25-45 | 45-65 | 65-85 |
| No of student(fi) | 4 | 10 | 23 | 34 |
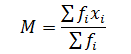
In these distribution, it is assumed that frequency of each class interval is centered around its mid point i.e class marks
Mean can be calculated using three method
a) Direct method
b) Assumed mean method
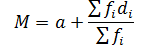
Where
a=> Assumed mean
di => xi –a
c) Step deviation Method
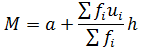
Where
a=> Assumed mean
ui => (xi –a)/h
Mode for grouped frequency table
Modal class: The class interval having highest frequency is called the modal class and Mode is obtained using the modal class
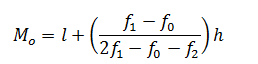
Where
l = lower limit of the modal class,
h = size of the class interval (assuming all class sizes to be equal),
f1 = frequency of the modal class,
f0 = frequency of the class preceding the modal class,
f2 = frequency of the class succeeding the modal class.
Cumulative Frequency chart
The cumulative frequency of a class is the frequency obtained by adding the frequencies of all the classes preceding the given class.
| Class interval ( Age) | No of Insurance policies |
| 15-20 | 2 |
| 20-25 | 4 |
| 25-30 | 16 |
| 30-35 | 20 |
| 35-40 | 20 |
| 40-45 | 12 |
Cumulative Frequency chart will be like
| Age in years | Cumulative No of Insurance policies |
| Less than 20 years | 2 |
| Less than 25 years | 6 |
| Less than 30 years | 22 |
| Less than 35 years | 42 |
| Less than 40 years | 62 |
| Less than 45 years | 74 |
Median of a grouped data frequency table
For the given data, we need to have class interval, frequency distribution and cumulative frequency distribution
Median is calculated as
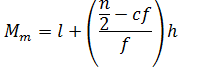
Where
l = lower limit of median class,
n = number of observations,
cf = cumulative frequency of class preceding the median class,
f = frequency of median class,
h = class size (assuming class size to be equal)
Empirical Formula between Mode, Mean and Median
3 Median=Mode +2 Mean


