
Take Tuition from the Best Tutors
Search in

Lesson Posted on 05/02/2018 Learn Probability
Playing Cards Nomenclature & Probability

Raj Kumar
I am Six Sigma Black belt trained from American Society of Quality I am 2011 pass out in B.tech from...
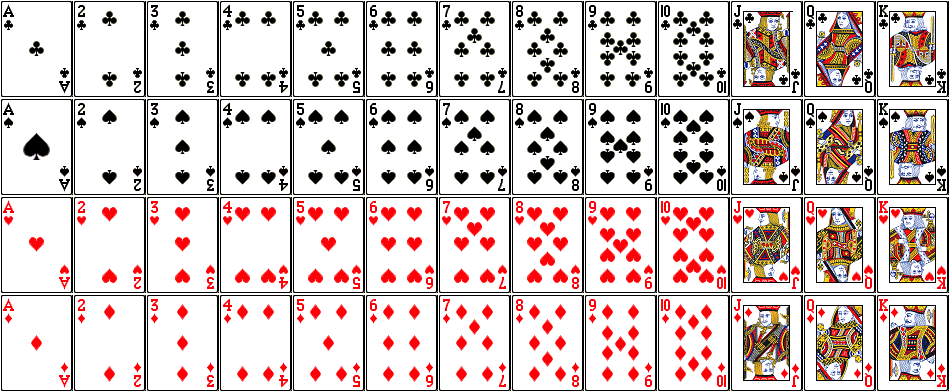
In a pack or deck of 52 playing cards, they are divided into 4 suits of 13 cards each i.e. spades ♠ hearts ♥, diamonds ♦, clubs ♣.
Total Blck Cards = 26
Total Red Cards = 26
Total Ace Cards = 4
Total Face cards = 12
Total Spade Cards = 13
Total Club cards = 13
Total Diamond Cards = 13
Total Hearts cards = 13
Total Jack Cards = 4
Total Queen Cards = 4
Total King Cards = 4
Face cards: Jacks, Queens, and Kings are called "face cards" because the cards have pictures of their names.
Question: A card is drawn from a well shuffled pack of 52 cards. Find the probability of:
(i) ‘2’ of spades.
(ii) A jack.
(iii) A king of red colour.
(iv) A card of diamond.
(v) A king or a queen.
(vi) A non-face card.
(vii) A black face card.
(viii) A black card.
(ix) A non-ace.
(x) Non-face card of black colour.
(xi) Neither a spade nor a jack.
(xii) Neither a heart nor a red king.
Solution:
In a playing card there are 52 cards.
Therefore the total number of possible outcomes = 52
(i) ‘2’ of spades:
Number of favourable outcomes i.e. ‘2’ of spades is 1 out of 52 cards.
Therefore, probability of getting ‘2’ of spade
Number of favorable outcomes
P(A) = Total number of possible outcome
= 1/52
(ii) A jack:
Number of favourable outcomes i.e. ‘a jack’ is 4 out of 52 cards.
Therefore, probability of getting ‘a jack’
Number of favorable outcomes
P(B) = Total number of possible outcome
= 4/52
= 1/13
(iii) A king of red colour:
Number of favourable outcomes i.e. ‘a king of red colour’ is 2 out of 52 cards.
Therefore, probability of getting ‘a king of red colour’
Number of favorable outcomes
P(C) = Total number of possible outcome
= 2/52
= 1/26
(iv) A card of diamond:
Number of favourable outcomes i.e. ‘a card of diamond’ is 13 out of 52 cards.
Therefore, probability of getting ‘a card of diamond’
Number of favorable outcomes
P(D) = Total number of possible outcome
= 13/52
= 1/4
(v) A king or a queen:
Total number of king is 4 out of 52 cards.
Total number of queen is 4 out of 52 cards
Number of favourable outcomes i.e. ‘a king or a queen’ is 4 + 4 = 8 out of 52 cards.
Therefore, probability of getting ‘a king or a queen’
Number of favorable outcomes
P(E) = Total number of possible outcome
= 8/52
= 2/13
(vi) A non-face card:
Total number of face card out of 52 cards = 3 times 4 = 12
Total number of non-face card out of 52 cards = 52 - 12 = 40
Therefore, probability of getting ‘a non-face card’
Number of favorable outcomes
P(F) = Total number of possible outcome
= 40/52
= 10/13
(vii) A black face card:
Cards of Spades and Clubs are black cards.
Number of face card in spades (king, queen and jack or knaves) = 3
Number of face card in clubs (king, queen and jack or knaves) = 3
Therefore, total number of black face card out of 52 cards = 3 + 3 = 6
Therefore, probability of getting ‘a black face card’
Number of favorable outcomes
P(G) = Total number of possible outcome
= 6/52
= 3/26
(viii) A black card:
Cards of spades and clubs are black cards.
Number of spades = 13
Number of clubs = 13
Therefore, total number of black card out of 52 cards = 13 + 13 = 26
Therefore, probability of getting ‘a black card’
Number of favorable outcomes
P(H) = Total number of possible outcome
= 26/52
= 1/2
(ix) A non-ace:
Number of ace cards in each of four suits namely spades, hearts, diamonds and clubs = 1
Therefore, total number of ace cards out of 52 cards = 4
Thus, total number of non-ace cards out of 52 cards = 52 - 4
= 48
Therefore, probability of getting ‘a non-ace’,
Number of favorable outcomes
P(I) = Total number of possible outcome
= 48/52
= 12/13
(x) Non-face card of black colour:
Cards of spades and clubs are black cards.
Number of spades = 13
Number of clubs = 13
Therefore, total number of black card out of 52 cards = 13 + 13 = 26
Number of face cards in each suits namely spades and clubs = 3 + 3 = 6
Therefore, total number of non-face card of black colour out of 52 cards = 26 - 6 = 20
Therefore, probability of getting ‘non-face card of black colour’,
Number of favorable outcomes
P(J) = Total number of possible outcome
= 20/52
= 5/13
(xi) Neither a spade nor a jack:
Number of spades = 13
Total number of non-spades out of 52 cards = 52 - 13 = 39
Number of jack out of 52 cards = 4
Number of jack in each of three suits namely hearts, diamonds and clubs = 3
[Since, 1 jack is already included in the 13 spades so, here we will take number of jacks is 3]
Neither a spade nor a jack = 39 - 3 = 36
Therefore, probability of getting ‘neither a spade nor a jack’,
Number of favorable outcomes
P(K) = Total number of possible outcome
= 36/52
= 9/13
(xii) Neither a heart nor a red king:
Number of hearts = 13
Total number of non-hearts out of 52 cards = 52 - 13 = 39
Therefore, spades, clubs and diamonds are the 39 cards.
Cards of hearts and diamonds are red cards.
Number of red kings in red cards = 2
Therefore, neither a heart nor a red king = 39 - 1 = 38
[Since, 1 red king is already included in the 13 hearts so, here we will take number of red kings is 1]
Therefore, probability of getting ‘neither a heart nor a red king’
Number of favorable outcomes
P(L) = Total number of possible outcome
= 38/52
= 19/26
These are the basic problems on probability with playing cards.
read lessLesson Posted on 11/01/2018 Learn Probability
Raj Kumar
I am Six Sigma Black belt trained from American Society of Quality I am 2011 pass out in B.tech from...
Let’s start with the easiest distribution that is Bernoulli Distribution.
It is actually easier to understand than it sounds!
All you cricket junkies out there! At the beginning of any cricket match, how do you decide who is going to bat or ball? A toss! It all depends on whether you win or lose the toss, right?
Let’s say if the toss results in a head, you win. Else, you lose. There’s no midway.
A Bernoulli distribution has only two possible outcomes, namely 1 (success) and 0 (failure), and a single trial. So the random variable X which has a Bernoulli distribution can take value 1 with the probability of success, say p, and the value 0 with the probability of failure, say q or 1-p.
Here, the occurrence of a head denotes success, and the occurrence of a tail denotes failure.
Probability of getting a head = 0.5 = Probability of getting a tail since there are only two possible outcomes.
The probability mass function is given by: px(1-p)1-x where x € (0, 1).
It can also be written as:
![]()
The probabilities of success and failure need not be equally likely, like the result of a fight between me and Undertaker. He is pretty much certain to win. So in this case probability of my success is 0.15 while my failure is 0.85
Here, the probability of success(p) is not same as the probability of failure. So, the chart below shows the Bernoulli Distribution of our fight.
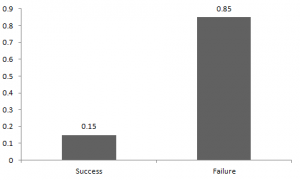
Here, the probability of success = 0.15 and probability of failure = 0.85. The expected value is exactly what it sounds. If I punch you, I may expect you to punch me back. Basically expected value of any distribution is the mean of the distribution. The expected value of a random variable X from a Bernoulli distribution is found as follows:
E(X) = 1*p + 0*(1-p) = p
The variance of a random variable from a binomial distribution is:
V(X) = E(X²) – [E(X)]² = p – p² = p(1-p)
There are many examples of Bernoulli distribution such as whether it’s going to rain tomorrow or not where rain denotes success and no rain denotes failure and Winning (success) or losing (failure) the game
read less
Lesson Posted on 11/01/2018 Learn Probability
Raj Kumar
I am Six Sigma Black belt trained from American Society of Quality I am 2011 pass out in B.tech from...
Uniform Distribution:
When you roll a fair die, the outcomes are 1 to 6.
The probabilities of getting these outcomes are equally likely and that is the basis of a uniform distribution.
Unlike Bernoulli Distribution, all the n number of possible outcomes of a uniform distribution are equally likely.
A variable X is said to be uniformly distributed if the density function is:
![]()
The graph of a uniform distribution curve looks like:
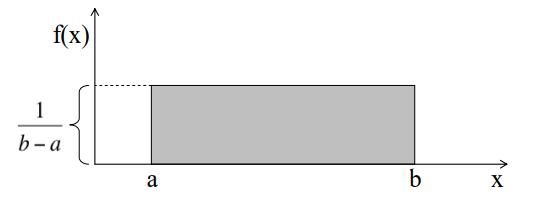
You can see that the shape of the Uniform distribution curve is rectangular, the reason why Uniform distribution is called rectangular distribution.
For a Uniform Distribution, a and b are the parameters.
The number of bouquets sold daily at a flower shop is uniformly distributed with a maximum of 40 and a minimum of 10.
Let’s try calculating the probability that the daily sales will fall between 15 and 30.
The probability that daily sales will fall between 15 and 30 is (30-15)*(1/(40-10)) = 0.5
Similarly, the probability that daily sales are greater than 20 is = 0.667
The mean and variance of X following a uniform distribution is:
Mean -> E(X) = (a+b)/2
Variance -> V(X) = (b-a)²/12
The standard uniform density has parameters a = 0 and b = 1, so the PDF for standard uniform density is given by:
![]()
Take Tuition from the Best Tutors
Lesson Posted on 11/01/2018 Learn Probability
Raj Kumar
I am Six Sigma Black belt trained from American Society of Quality I am 2011 pass out in B.tech from...
Let’s get back to cricket. Suppose that you won the toss today and this indicates a successful event. You toss again but you lost this time. If you win a toss today, this does not necessitate that you will win the toss tomorrow. Let’s assign a random variable, say X, to the number of times you won the toss. What can be the possible value of X? It can be any number depending on the number of times you tossed a coin.
There are only two possible outcomes. Head denoting success and tail denoting failure. Therefore, probability of getting a head = 0.5 and the probability of failure can be easily computed as: q = p – 1 = 0.5.
A distribution where only two outcomes are possible, such as success or failure, gain or loss, win or lose and where the probability of success and failure is same for all the trials is called a Binomial Distribution.
The outcomes need not be equally likely. Remember the example of a fight between me and Undertaker? So, if the probability of success in an experiment is 0.2 then the probability of failure can be easily computed as q = 1 – 0.2 = 0.8.
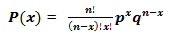
Each trial is independent since the outcome of the previous toss doesn’t determine or affect the outcome of the current toss. An experiment with only two possible outcomes repeated n number of times is called binomial. The parameters of a binomial distribution are n and p where n is the total number of trials and p is the probability of success in each trial.
On the basis of the above explanation, the properties of a Binomial Distribution are:
The mathematical representation of binomial distribution is given by:
A binomial distribution graph where the probability of success does not equal the probability of failure looks like:

Now, when probability of success = probability of failure, in such a situation the graph of binomial distribution looks like:
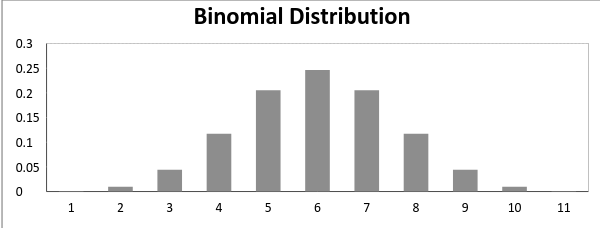
The mean and variance of a binomial distribution are given by:
Mean -> µ = n*p
Variance -> Var(X) = n*p*q
read lessLesson Posted on 11/01/2018 Learn Probability
Raj Kumar
I am Six Sigma Black belt trained from American Society of Quality I am 2011 pass out in B.tech from...
Normal distribution represents the behavior of most of the situations in the universe (That is why it’s called a “normal” distribution. I guess!). The large sum of (small) random variables often turns out to be normally distributed, contributing to its widespread application. Any distribution is known as Normal distribution if it has the following characteristics:
A normal distribution is highly different from Binomial Distribution. However, if the number of trials approaches infinity then the shapes will be quite similar.
The PDF of a random variable X following a normal distribution is given by:
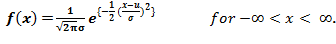
The mean and variance of a random variable X which is said to be normally distributed is given by:
Mean -> E(X) = µ
Variance -> Var(X) = σ^2
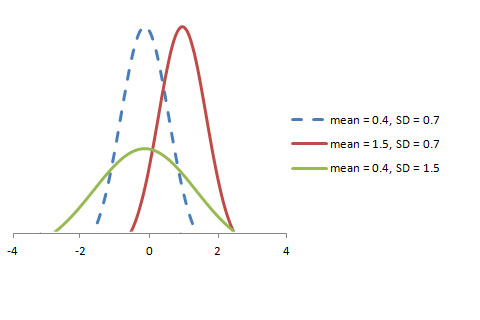
Here, µ (mean) and σ (standard deviation) are the parameters. The graph of a random variable X ~ N (µ, σ) is shown below:
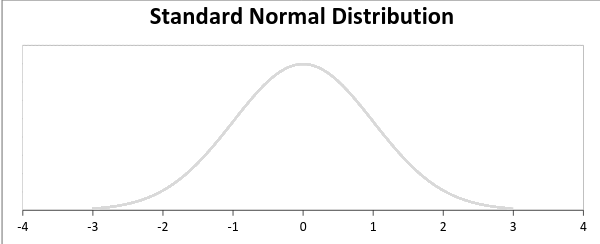
A standard normal distribution is defined as the distribution with mean 0 and standard deviation 1. For such a case, the PDF becomes:
![]()
Lesson Posted on 11/01/2018 Learn Probability
Raj Kumar
I am Six Sigma Black belt trained from American Society of Quality I am 2011 pass out in B.tech from...
Let’s consider the call center example one more time. What about the interval of time between the calls ? Here, exponential distribution comes to our rescue. Exponential distribution models the interval of time between the calls.
Other examples are:
1. Length of time beteeen metro arrivals,
2. Length of time between arrivals at a gas station
3. The life of an Air Conditioner
Exponential distribution is widely used for survival analysis. From the expected life of a machine to the expected life of a human, exponential distribution successfully delivers the result.
A random variable X is said to have an exponential distribution with PDF:
f(x) = { λe-λx, x ≥ 0
and parameter λ>0 which is also called the rate.
For survival analysis, λ is called the failure rate of a device at any time t, given that it has survived up to t.
Mean and Variance of a random variable X following an exponential distribution:
Mean -> E(X) = 1/λ
Variance -> Var(X) = (1/λ)².
read lessTake Tuition from the Best Tutors
Answered on 02/12/2016 Learn Probability

Sreedevi Addepalli
Teacher
Answered on 02/12/2016 Learn Probability
Sreedevi Addepalli
Teacher
Answered on 02/12/2016 Learn Probability
Sreedevi Addepalli
Teacher
Take Tuition from the Best Tutors
Answered on 02/12/2016 Learn Probability
Sreedevi Addepalli
Teacher
UrbanPro.com helps you to connect with the best Tuition in India. Post Your Requirement today and get connected.
Ask a Question
The best tutors for Tuition Classes are on UrbanPro

The best Tutors for Tuition Classes are on UrbanPro


