UrbanPro
true

Learn Stock Market Investing from the Best Tutors

  • Affordable fees
  • 1-1 or Group class
  • Flexible Timings
  • Verified Tutors

Open Interest And Volume Theory

Bhavani Prasad Maddala
16/02/2018 0 0
Open interest is an indicator often used by traders to confirm trends and trend reversals for both the futures and options markets. Open interest represents the total number of open contracts on a security. Here we'll take a look at the importance of the relationship between volume and open interest in confirming trends and their impending changes. (Check out an introduction to the concept of open interest in Intro To Open Interest In The Futures Market.)

Volume and Open Interest:
Used in conjunction with open interest, volume represents the total number of shares or contracts that have changed hands in a one-day trading session in the commodities or options market. The greater the amount of trading during a market session, the higher the trading volume. A new student to technical analysis can easily see that the volume represents a measure of intensity or pressure behind a price trend. The greater the volume, the more we can expect the existing trend to continue rather than reverse.

Technicians believe that volume precedes price, which means that the loss of either upside price pressure in an uptrend or downside pressure in a downtrend will show up in the volume figures before presenting itself as a reversal in trend on the bar chart. The rules that have been set in stone for both volume and open interest are combined because of their similarity; however, having said that, there are always exceptions to the rule.

General Rules for Volume and Open Interest:
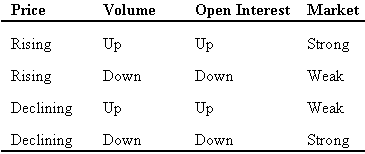
The chart below summarize the rules for volume and open interest.
                                         112002_1.gif
Figure 1: General rules for volume and open interest

So, price action increasing in an uptrend and open interest on the rise is interpreted as new money coming into the market (reflecting new buyers); this is considered bullish. Now, if the price action is rising and the open interest is on the decline, short sellerscovering their positions are causing the rally. Money is therefore leaving the marketplace; this is a bearish sign.


If prices are in a downtrend and open interest is on the rise, chartists know that new money is coming into the market, showing aggressive new short selling. This scenario will prove out a continuation of a downtrend and a bearish condition. Lastly, if the total open interest is falling off and prices are declining, the price decline is likely being caused by disgruntled long position holders being forced to liquidate their positions. Technicians view this scenario as a strong position technically because the downtrend will end once all the sellers have sold their positions. The following chart therefore emerges:

                                          112002_2.gif
Figure 2: Bullish and bearish signs according to open interest

When open interest is high at a market top and the price falls off dramatically, this scenario should be considered bearish. In other terms, this means that all of the long position holders that bought near the top of the market are now in a loss position, and their panic to sell keeps the price action under pressure.

0 Dislike
Follow 3

Please Enter a comment

Submit

Other Lessons for You

How can you predict the rise & fall in the stock's price in day trading?
Yes you can’t ( predict ) Let this prediction sticks with the Pandit’s only. No pun intended I do respect them for their predictions and knowledge they have in there arena. But let’s...

What are the important macroeconomic indicators that influence stock market?
What are the important macroeconomic indicators that influence stock market? Following are the macroeconomic indicators that influence stock market:- GDP Growth Rate- Behaviour of monsoon and performance...

Secret Of Demand Supply
In every Business, there is a concept that buys at a low price or wholesale price and sells at a higher price or retail price. Same way whether we are going to purchase some stock or a commodity we must...

What is secondary market and SEBI ?
(Secondary Market) It is a kind of market, where investors buy and sell securities they already own. Generally most people typically think of as “stock market”. To control all kind of illegal...

What is Demat Account ? How we can open.
Demat Account : - Demat a/c is like a bank account we can keep securities in it rather than money. If we calssify the demat we will find 2 portion : 1. Trading a/c : Where we can keep cash only 2....

Looking for Stock Market Investing classes?

Learn from Best Tutors on UrbanPro.

Are you a Tutor or Training Institute?

Join UrbanPro Today to find students near you
X

Looking for Stock Market Investing Classes?

The best tutors for Stock Market Investing Classes are on UrbanPro

  • Select the best Tutor
  • Book & Attend a Free Demo
  • Pay and start Learning

Learn Stock Market Investing with the Best Tutors

The best Tutors for Stock Market Investing Classes are on UrbanPro

This website uses cookies

We use cookies to improve user experience. Choose what cookies you allow us to use. You can read more about our Cookie Policy in our Privacy Policy

Accept All
Decline All

UrbanPro.com is India's largest network of most trusted tutors and institutes. Over 55 lakh students rely on UrbanPro.com, to fulfill their learning requirements across 1,000+ categories. Using UrbanPro.com, parents, and students can compare multiple Tutors and Institutes and choose the one that best suits their requirements. More than 7.5 lakh verified Tutors and Institutes are helping millions of students every day and growing their tutoring business on UrbanPro.com. Whether you are looking for a tutor to learn mathematics, a German language trainer to brush up your German language skills or an institute to upgrade your IT skills, we have got the best selection of Tutors and Training Institutes for you. Read more