UrbanPro
true

Learn Stock Market Trading from the Best Tutors

  • Affordable fees
  • 1-1 or Group class
  • Flexible Timings
  • Verified Tutors

Learn Commodities Trading with Free Lessons & Tips

Ask a Question

Post a Lesson

All

All

Lessons

Discussion

Lesson Posted on 07/07/2020 Learn Commodities Trading +4 Stock Market Trading Technical Analysis Derivatives Trading Intraday Trading

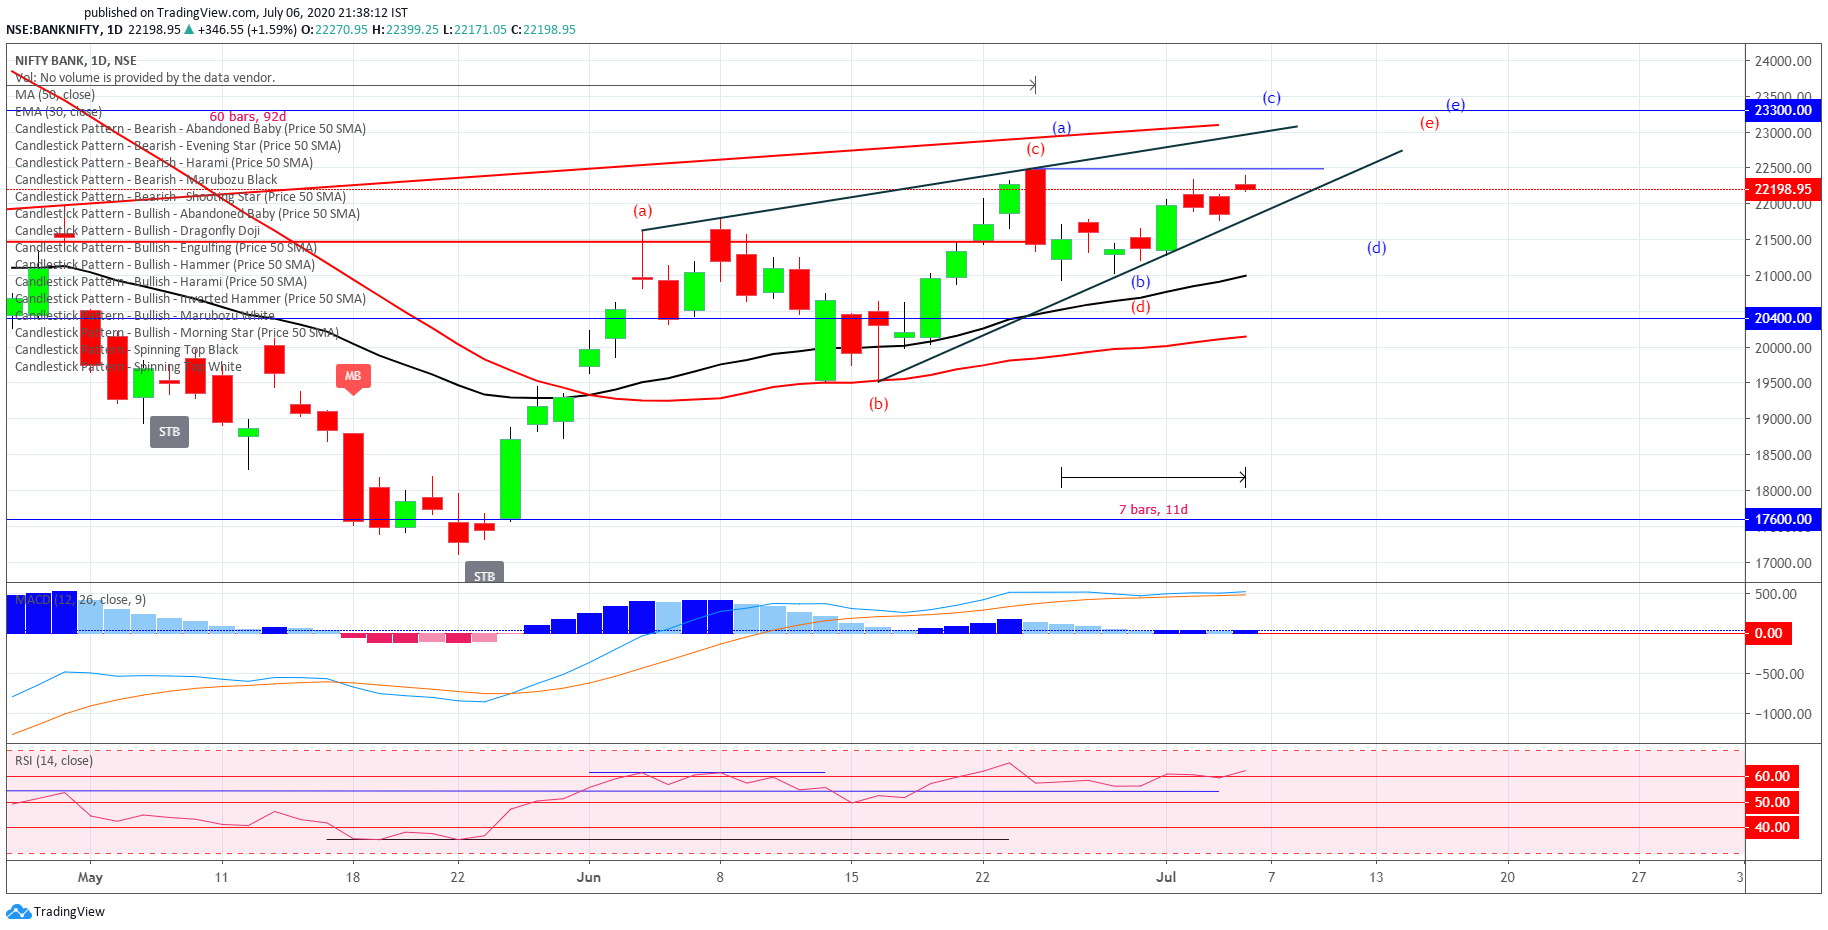
BankNifty Update for Jul-06, 2020

Ninad

In the update for Jul-02 post, I mentioned "The hourly chart gave a bullish MA crossover. Bullish crossover after bearish crossover suggests the rangebound possibility. The range maybe 21300-22300." In the update for Jul-03 post"The hourly chart shows the possibility of Banknifty coming towards moving... read more

In the update for Jul-02 post, I mentioned "The hourly chart gave a bullish MA crossover. Bullish crossover after bearish crossover suggests the rangebound possibility. The range maybe 21300-22300."

In the update for Jul-03 post"The hourly chart shows the possibility of Banknifty coming towards moving averages (21750-21600) before it starts moving up."
 
Banknifty exactly moved in a range for the last two days and came back to 30-EMA. 
 
The daily chart shows Banknifty taking support near the lower line of the wedge. As long as this support is respected, we can expect an upside move towards 22500/22700/22900.
The hourly chart shows Banknifty taking support @ 30-EMA and Gann Number of 21800. The hourly chart shows a wedge formation. Break of this wedge may give some right sharp moves on either side.

VIX:

The daily Gann Box shows we are near the time factor. We may see a trend change in VIX in the next few days.
The hourly chart of VIX clearly shows the possibility of a spike in VIX as it is at channel support and RSI also at support.

FNO Data:

The change in future OI is not significant (increased by 1.5%). The spot to future is @ discount of 8.5, changed from the premium of 24—nothing much to conclude from this data.
 

Trade Plan:

Above 21950 targets are 22050/21120/22300/22450
Below 21650 targets are 21550/21400/21250/21100
 
I have a bullish bias. 
 
We may see some move tomorrow as we have Lunar eclipse on Jul-05. The effect may be seen on Jul-06. Jul-07 is a minor Gann date. So we may see some sharp moves in the coming days or maybe short term top on Jul-07.


read less
Comments
Dislike Bookmark

Lesson Posted on 07/07/2020 Learn Commodities Trading +4 Stock Market Trading Technical Analysis Derivatives Trading Intraday Trading

Stocks to watch for Week Jul-06, 2020

Ninad

BATAINDIA: (CMP: 1298) Bullish The price at lower channel support. The daily RSI is also taking help @ 40 levels. Targets 1350/1400/1425 SL @1365. ONGC: (CMP: 82.40) Bullish Targets 90/91 Sl @78 DIVISLAB: (CMP: 2190) Bearish Targets 2020/1850 SL @ 2290 read more

BATAINDIA: (CMP: 1298) Bullish

The price at lower channel support. The daily RSI is also taking help @ 40 levels. Targets 1350/1400/1425 SL @1365. 

ONGC:  (CMP: 82.40) Bullish

Targets 90/91 Sl @78
 

DIVISLAB:  (CMP: 2190) Bearish

Targets 2020/1850 SL @ 2290
 
 
read less
Comments
Dislike Bookmark

Lesson Posted on 07/07/2020 Learn Commodities Trading +4 Stock Market Trading Technical Analysis Derivatives Trading Intraday Trading

BankNifty Update for Jul-07

Ninad

Banknifty opened Gap up 400+ points, and then there was not much of trading opportunity as it was rangebound throughout the day. There is still a possibility of upmove towards 22500/22700, but the daily chart is showing a lack of momentum. It is interesting to observe that Banknifty did not break the... read more

Banknifty opened Gap up 400+ points, and then there was not much of trading opportunity as it was rangebound throughout the day. There is still a possibility of upmove towards 22500/22700, but the daily chart is showing a lack of momentum.

It is interesting to observe that Banknifty did not break the top made on Jun-24 @ 22479 though Nifty-50 made a new top. So there is a divergence in Nifty and Banknifty. It is a sign of weakness unless Banknifty catches with Nifty.

Jul-07 is the Gann date (minor time cycle). It will be interesting to watch whether it breaks Jun-24 high and reverse or continue upmove.

 
The hourly chart shows consolidation after the gap up. Hence, the possibility of further upmove is strong.
 

FNO Data:

The future OI decreased by 8% with an increase in price. So normal analysis suggests Short covering. But it looks like long unwinding as we saw longs building the last two days. So we need to be cautious at higher levels.
 

Trade Plan:

Above 22330 targets are 22450/22550/22700
Below 22120 targets are 21950/21800
 
I am cautiously Bullish.
read less
Comments
Dislike Bookmark

Learn Stock Market Trading from the Best Tutors

  • Affordable fees
  • Flexible Timings
  • Choose between 1-1 and Group class
  • Verified Tutors

Lesson Posted on 07/07/2020 Learn Commodities Trading +4 Stock Market Trading Technical Analysis Derivatives Trading Intraday Trading

Stocks to Watch on Jul-07, 2020

Ninad

Hindalco:(CMP - 154.35) Bullish Target 160 / SL@152 VOLTAS: (CMP - 566.50) Bullish Target 585/600 SL @ 552 TITAN:(CMP - 1014.20) Bullish Target 1050/1055 SL @ 992 read more

Hindalco:(CMP - 154.35) Bullish

Target 160 / SL@152

VOLTAS: (CMP - 566.50) Bullish

Target 585/600  SL @ 552 

TITAN:(CMP - 1014.20) Bullish

Target 1050/1055  SL @ 992
 
 
read less
Comments
Dislike Bookmark

Lesson Posted on 02/07/2020 Learn Commodities Trading +4 Stock Market Trading Technical Analysis Derivatives Trading Intraday Trading

BankNifty Update For Jul-02,2020

Ninad

Banknifty gave breakout on the upside of the triangle pattern and made good upmove achieving our last target of 22000, making top @ 22061. The daily chart shows Banknifty is forming a wedge and prices are contracting. The upper line of the wedge is in the range of 22800-900. It would also be interesting... read more

Banknifty gave breakout on the upside of the triangle pattern and made good upmove achieving our last target of 22000, making top @ 22061.

 
The daily chart shows Banknifty is forming a wedge and prices are contracting. The upper line of the wedge is in the range of 22800-900. It would also be interesting to see whether Banknifty takes out Jun-24 top of 21479.
The hourly chart gave a bullish MA crossover. Bullish crossover after bearish crossover suggests the rangebound possibility. The range maybe 21300-22300.
 

Gann Box:

The daily Gann Box shows resistance @ 22200-22300/22500. On the weekly chart, 22550/22800 is strong resistance.
 
They opened on an angle on Monthly Gann Box. Suggesting the possibility of good upmove(already 700 points move today). Next resistance @22950.

FNO Data:

The future OI increased by  7.7% with an increase in price, suggesting long buildup. Also, the spot to future discount reduced substantially from 156 to 47, suggesting bullish sentiment in the short term.
 

Trade Plan:

Above 22100 targets are 22300/22500/22800
Below 21800 targets are 21600/21500/21300
 
read less
Comments
Dislike Bookmark

Lesson Posted on 03/07/2020 Learn Commodities Trading +4 Stock Market Trading Technical Analysis Derivatives Trading Intraday Trading

BankNifty Update For Jul-03, 2020

Ninad

Banknifty opened 150+ points gap up @ 22133, reached our 1st target of 22300. It made top @ 22344 but could not sustain and sharply came down to 21900 levels. After that, it was typical expiry day rangebound move between 21900 and 22250. The daily chart shows RSI holding 60 levels and the MACD line... read more

Banknifty opened 150+ points gap up @ 22133, reached our 1st target of 22300. It made top @ 22344 but could not sustain and sharply came down to 21900 levels. After that, it was typical expiry day rangebound move between 21900 and 22250.

 
The daily chart shows RSI holding 60 levels and the MACD line above the signal line. So further upmove is likely towards 22450-500 (recent top) and 22800-900 towards wedge upper line. But MACD histogram showing a lack of strong momentum in upmove.
The hourly chart shows the possibility of Banknifty coming towards moving averages (21750-21600) before it starts moving up.

FNO Data:

There is not much change in future OI (1%). But the spot to future difference is now @ premium of 24 from the discount of 47, a change of 71 points, suggesting short term bullish sentiments( or at least change from bearish sentiment). Since this is a long monthly expiry month, the premium should be much higher (So it is not strong bullish sentiment).
 

Trade Plan:

Above 22050 targets are 22200/220300/22450/22550/22700
Below 21900 targets are 21750/21600/21300
 
 
read less
Comments
Dislike Bookmark

Learn Stock Market Trading from the Best Tutors

  • Affordable fees
  • Flexible Timings
  • Choose between 1-1 and Group class
  • Verified Tutors

Lesson Posted on 01/07/2020 Learn Commodities Trading +4 Stock Market Trading Technical Analysis Derivatives Trading Intraday Trading

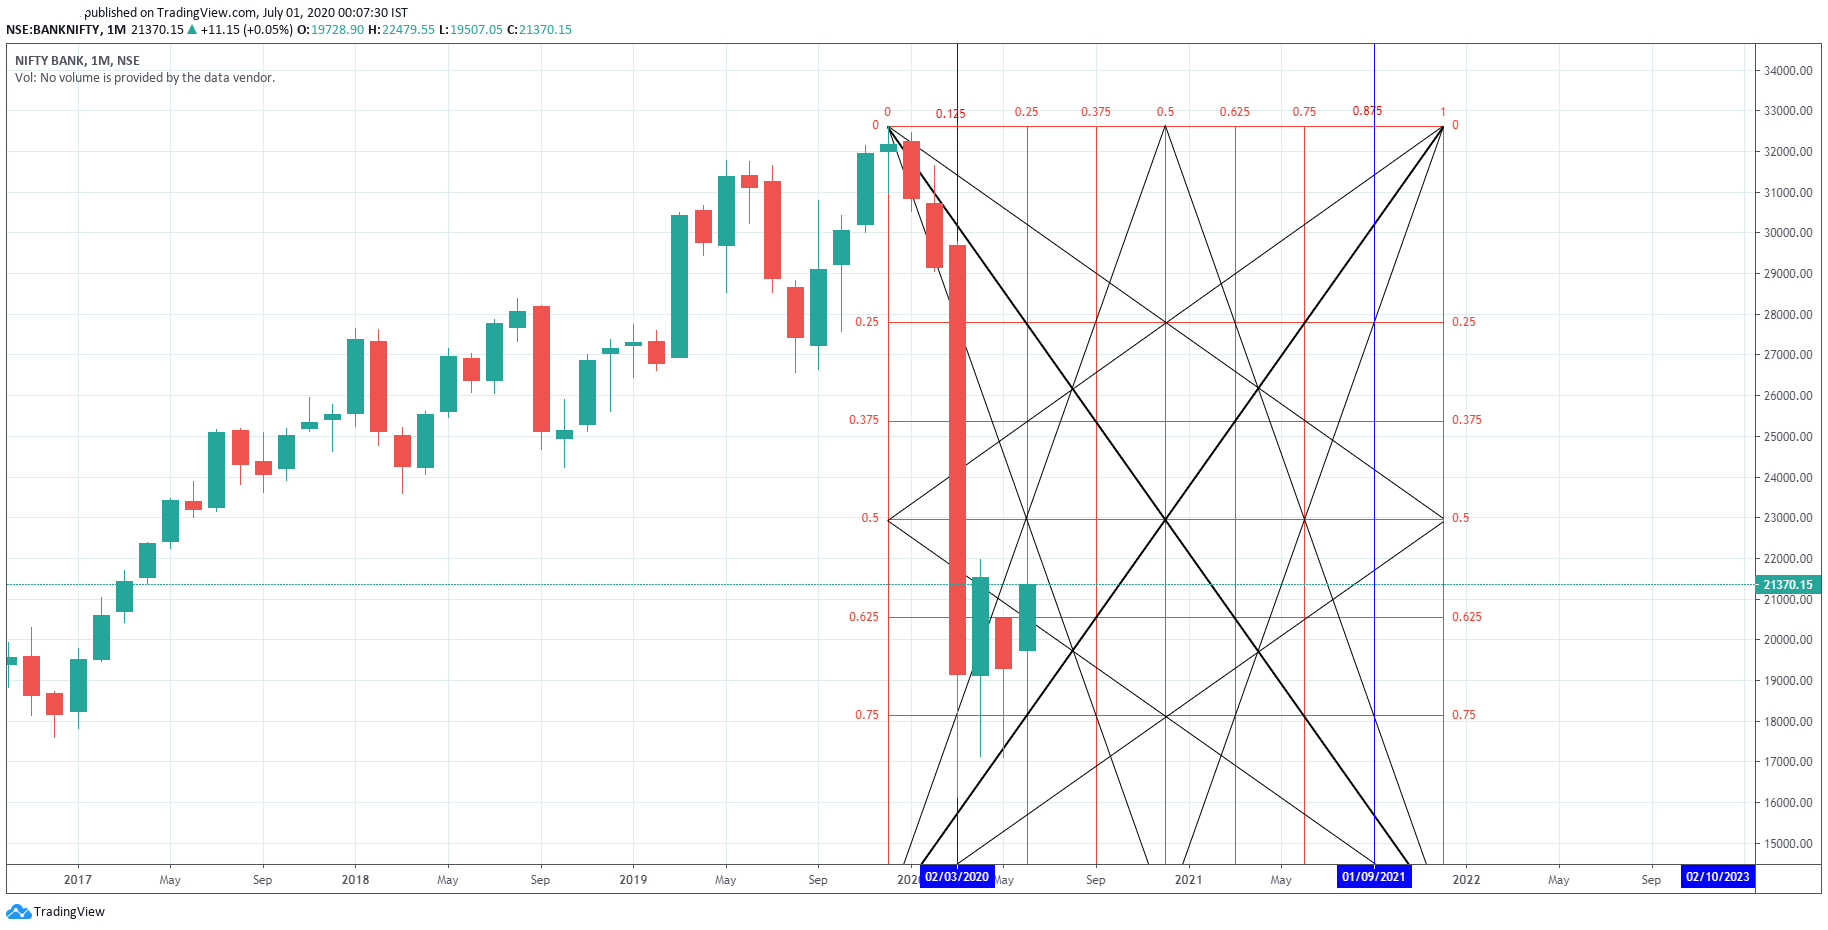
BankNifty Monthly Analysis For Jul-2020

Ninad

The observation on Monthly Banknifty chart: The three months from the top made in Dec-2019 to the low of Mar-2020 Three months from Mar-2020 ends in Jun-2020. Possible Trend change. The Mar low to Jun top monthly candle pattern looks like flat A-B-C correction of the wave from the top of... read more

The observation on Monthly Banknifty chart:

 
  • The three months from the top made in Dec-2019 to the low of Mar-2020
  • Three months from Mar-2020 ends in Jun-2020. Possible Trend change.
  • The Mar low to Jun top monthly candle pattern looks like flat A-B-C correction of the wave from the top of Dec-2019. So the further down move is expected.
  • The bank nifty is now near the resistance of the monthly 70-EMA that provided strong support earlier. It may currently offer stiff resistance.
  • The 14-period RSI on the monthly chart is @ res level of 40(40.73).
 
All these points are directing towards the high probability of down move towards Mar low or much lower in the coming months.
The 2-Monthly chart shows bearish MA crossover (EMA-14 and SMA-20)
 
The 3-Monthly chart also shows bearish crossover (9-EMA &14-SMA)
14-period RSI is @ Resistance level of 50
 

Gann Monthly Angle Chart:

Reversal from Gann Angle.

Gann Box:

The Monthly Gann Box is suggesting trend reversal possibility as per time factor (the vertical line of 0.25-1/4th part of Box). The earlier reversal was from 1/8th of Box (0.125 vertical lines) in Mar-2020.
 

VIX :

The monthly angle chart shows a reversal from angle and Doji candle formation, which is a reversal pattern. So an increase in VIX is very likely. 
 
It would be interesting to see if it opens at 1/1 angle or take support @ 1/1 angle in July.
 
The idea behind posting various charts is that all studies are aligned towards a trend reversal. So we need to be cautious on the upside.
 
I have a strong bias for bearish move in the coming months.
read less
Comments
Dislike Bookmark

Lesson Posted on 01/07/2020 Learn Commodities Trading +4 Stock Market Trading Technical Analysis Derivatives Trading Intraday Trading

BankNifty Update for Jul-01, 2020

Ninad

Banknifty reversed exactly from the resistance zone of 21600-650 as I mentioned in the last post. It made top @ 21606 near hourly 40-SMA and reversed back making a low of 21212 and closing @21370. The daily chart shows Banknifty still taking support on the lower line of the channel and moving in... read more

Banknifty reversed exactly from the resistance zone of 21600-650 as I mentioned in the last post. It made top @ 21606 near hourly 40-SMA and reversed back making a low of 21212 and closing @21370.

 
The daily chart shows Banknifty still taking support on the lower line of the channel and moving in a very narrow range for the last four days. Breaking 20900 may take it to 19700-19500 levels.
The hourly chart shows triangle pattern formation with the possibility of movement on either side after breaking out of the pattern. The bearish crossover suggests a strong chance of the down move even if it opens gap up. It needs to sustain above 21800 for further upmove. 21550-600 will act as resistance.

FNO Data:

Future OI increased by 9% with a decrease in price, suggesting short build-up. The spot to future discount is increased to 156 from 124, suggesting a continuation of bearish sentiments.
 

Trade Plan:

Above 21600 targets are 21800/22000
Below 21300 targets are 21100/20900/20400
read less
Comments
Dislike Bookmark

Lesson Posted on 30/06/2020 Learn Commodities Trading +4 Stock Market Trading Technical Analysis Derivatives Trading Intraday Trading

BankNifty Weekly Analysis - For Week Starting Jun-29, 2020

Ninad

Banknifty formed Doji candle on Weekly chart after making a top @ 22479 on Jun-24. Forming Doji candles near resistance creates a possibility of a trend reversal. Resistance is coming from the zone of moving averages (30EMA-21800 and 20-SMA-21126) and upper channel line. Also, 13-weeks completed... read more

Banknifty formed Doji candle on Weekly chart after making a top @ 22479 on Jun-24. Forming Doji candles near resistance creates a possibility of a trend reversal. Resistance is coming from the zone of moving averages (30EMA-21800 and 20-SMA-21126) and upper channel line.

 
Also, 13-weeks completed from the low of Mar, indicating the possibility of a trend change. Or it may consolidate between 21800-21000, before any directional move. We need to watch whether top made on Jun-24 remains protected.

Gann Box:

Weekly Gann Box shows we are near 1/4th time zone (Last week was @ 1/4th point), suggesting the possibility of a trend change. Low of Mar was exactly @ 1/8th point.
 

VIX:

The weekly chart shows RSI@ support. So likely upmove in VIX. In that case, we may see a fall in Banknifty.
 

Trade Plan: Swing Trade

Above 21800 targets are 22500/22800/23300/23700
 
Below 21100 targets are 20400/19700
read less
Comments
Dislike Bookmark

Learn Stock Market Trading from the Best Tutors

  • Affordable fees
  • Flexible Timings
  • Choose between 1-1 and Group class
  • Verified Tutors

Lesson Posted on 30/06/2020 Learn Commodities Trading +4 Stock Market Trading Technical Analysis Derivatives Trading Intraday Trading

BankNifty Update for Jun-29, 2020

Ninad

On Jun-26, Banknifty traded in a range of 21800-21300. The daily chart shows the possibility of the formation of a wedge structure. The bearish divergence on the MACD histogram reinforces this wedge possibility. So we need to be cautious on the upside. The top made on 24-Jun was precisely 60 trading... read more

On Jun-26, Banknifty traded in a range of 21800-21300. The daily chart shows the possibility of the formation of a wedge structure. The bearish divergence on the MACD histogram reinforces this wedge possibility. So we need to be cautious on the upside.

 
The top made on 24-Jun was precisely 60 trading days (and 92 calendar days) from low made on Mar-24. It suggests a trend change possibility with Jun-24 as a top. The Low made on Mar-24 was precisely 60 trading days from the top made on Dec-30, 2019.
The Hourly chart shows a bearish MA crossover. The bank nifty is now consolidating in the range after crossover. It increases the possibility of down move or further consolidation in the range of 21800-21300 before any big upmove.

Gann Box:

The daily gann Box shows a strong resistance zone @ 22000-22200 and support @ 20700-20400.
 

FNO Data:

Future OI reduced by 6% suggesting short covering, but a considerable discount in the spot to future price (130 points) indicates bearish sentiments.
 

Trade Plan:

Above 21800 targets are 22000/22200
Below 21300 targets are 20950/20700
 
read less
Comments
Dislike Bookmark

About UrbanPro

UrbanPro.com helps you to connect with the best Stock Market Trading Classes in India. Post Your Requirement today and get connected.

Overview

Lessons 60

Total Shares  

+ Follow 67,024 Followers

You can also Learn

Top Contributors

Connect with Expert Tutors & Institutes for Commodities Trading

x

Ask a Question

Please enter your Question

Please select a Tag

X

Looking for Stock Market Trading Classes?

The best tutors for Stock Market Trading Classes are on UrbanPro

  • Select the best Tutor
  • Book & Attend a Free Demo
  • Pay and start Learning

Learn Stock Market Trading with the Best Tutors

The best Tutors for Stock Market Trading Classes are on UrbanPro

This website uses cookies

We use cookies to improve user experience. Choose what cookies you allow us to use. You can read more about our Cookie Policy in our Privacy Policy

Accept All
Decline All

UrbanPro.com is India's largest network of most trusted tutors and institutes. Over 55 lakh students rely on UrbanPro.com, to fulfill their learning requirements across 1,000+ categories. Using UrbanPro.com, parents, and students can compare multiple Tutors and Institutes and choose the one that best suits their requirements. More than 7.5 lakh verified Tutors and Institutes are helping millions of students every day and growing their tutoring business on UrbanPro.com. Whether you are looking for a tutor to learn mathematics, a German language trainer to brush up your German language skills or an institute to upgrade your IT skills, we have got the best selection of Tutors and Training Institutes for you. Read more