
Learn Stock Market Trading from the Best Tutors
Search in

Lesson Posted on 14/02/2023 Learn Derivatives Trading

Adithyae Learning
I am Shanmukha Rao D with 15 years of Traditional and Digital Marketing experience. Globally accredited...
Order flow analytics is a methodology used in the stock market to analyze the flow of buy and sell orders for a specific stock or financial instrument. The goal of order flow analytics is to provide a more complete picture of market activity and to gain a deeper understanding of market sentiment and potential price movements.
Order flow analytics combines information from various sources, including market data, trade reports, and order book data, to create a comprehensive view of market activity. This information can include information about the number and size of trades, the type of orders being executed, and the timing and frequency of trades.
Order flow analytics can be used by traders to identify trends and market momentum, and to make more informed trading decisions. It is commonly used by institutional traders and algorithmic traders, but is less commonly used by retail investors.
Note: Order flow analytics can be complex and requires a deep understanding of financial markets and trading. It is important to exercise caution and seek professional advice before using order flow analytics for trading purposes.
read lessAnswered on 21/07/2021 Learn Derivatives Trading

Shanmugam P
Options Trader and Trainer with 8+ Years Experience
Lesson Posted on 15/07/2020 Learn Derivatives Trading
BanknIfty Update for Jul-15, 2020
Ninad
Banknifty opened Gap Down and continuously moved down. In the last two days, it almost falls more than 1200 points. We can capture this move from nearly the top of 23000.


Learn Stock Market Trading from the Best Tutors
Lesson Posted on 15/07/2020 Learn Derivatives Trading
Ninad
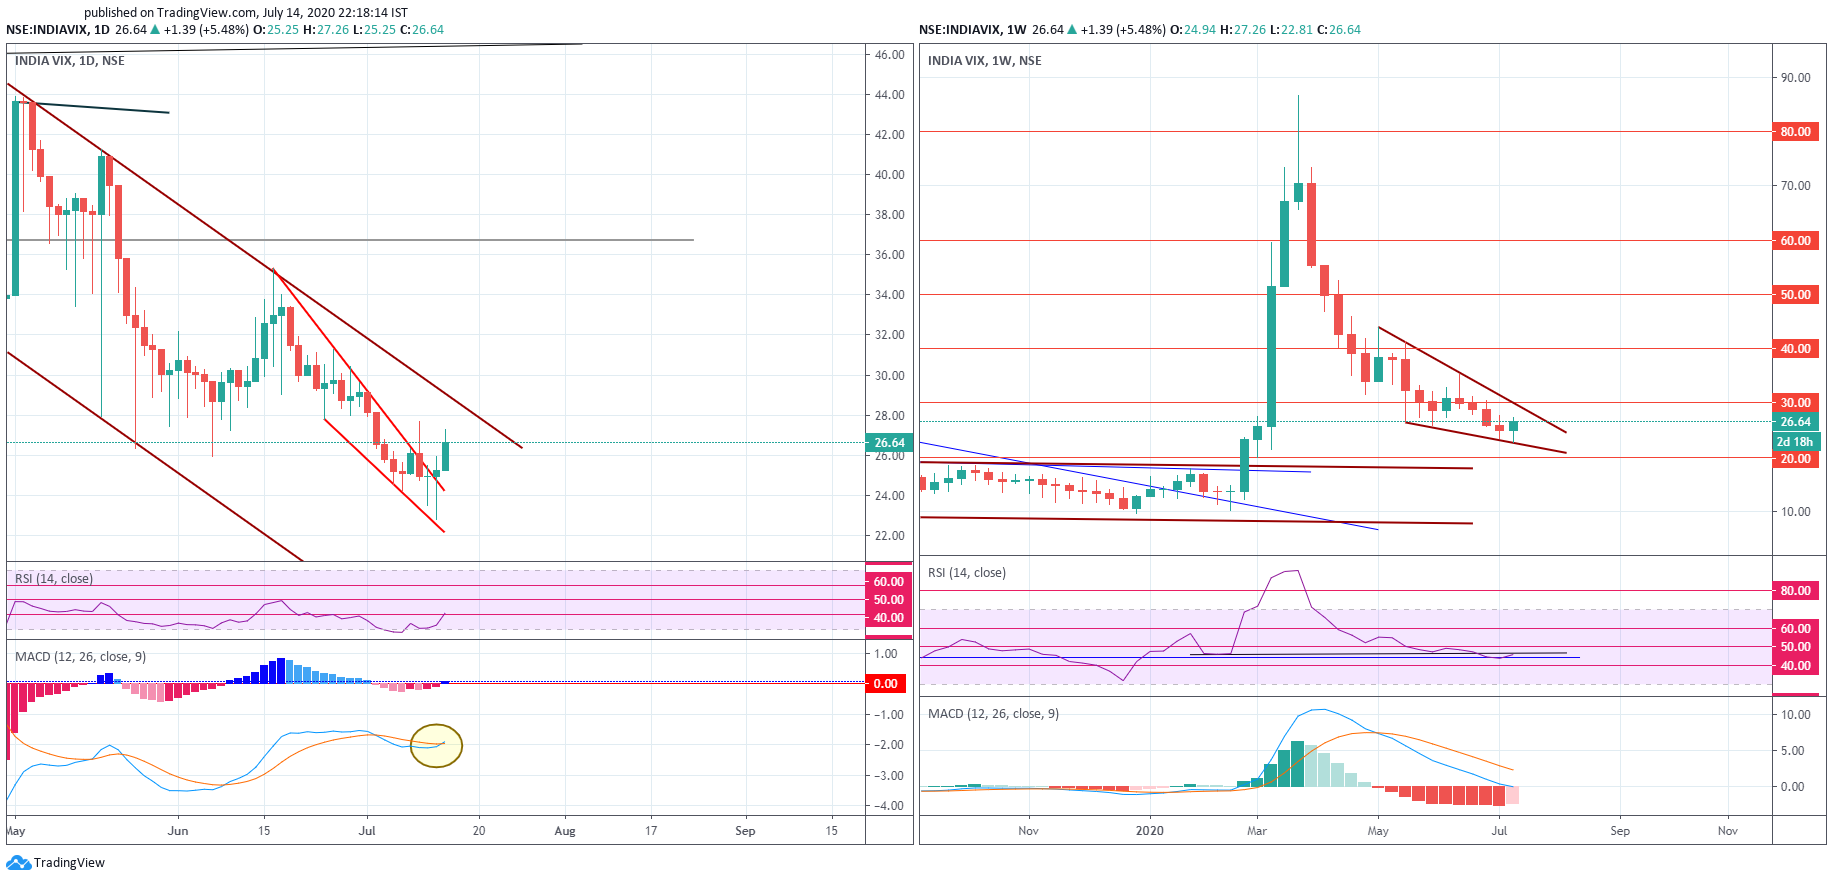
The daily VIX chart shows the formation of Doji candles at the bottom and reversal. The daily RSI crossed the previous resistance level of 40. The MACD signal gave bullish crossover suggesting bullish move in VIX. So the daily chart shows the possibility of VIX moving towards 28 levels in the coming days.
The weekly chart shows the formation of wedge and reversal from the bottom. VIX may move towards the upper wedge line @ 29-30.
So VIX suggesting the bearish mood of the market and hence the high possibility of fall in Nifty-50 and Banknifty in the coming days/weeks.

Lesson Posted on 14/07/2020 Learn Derivatives Trading
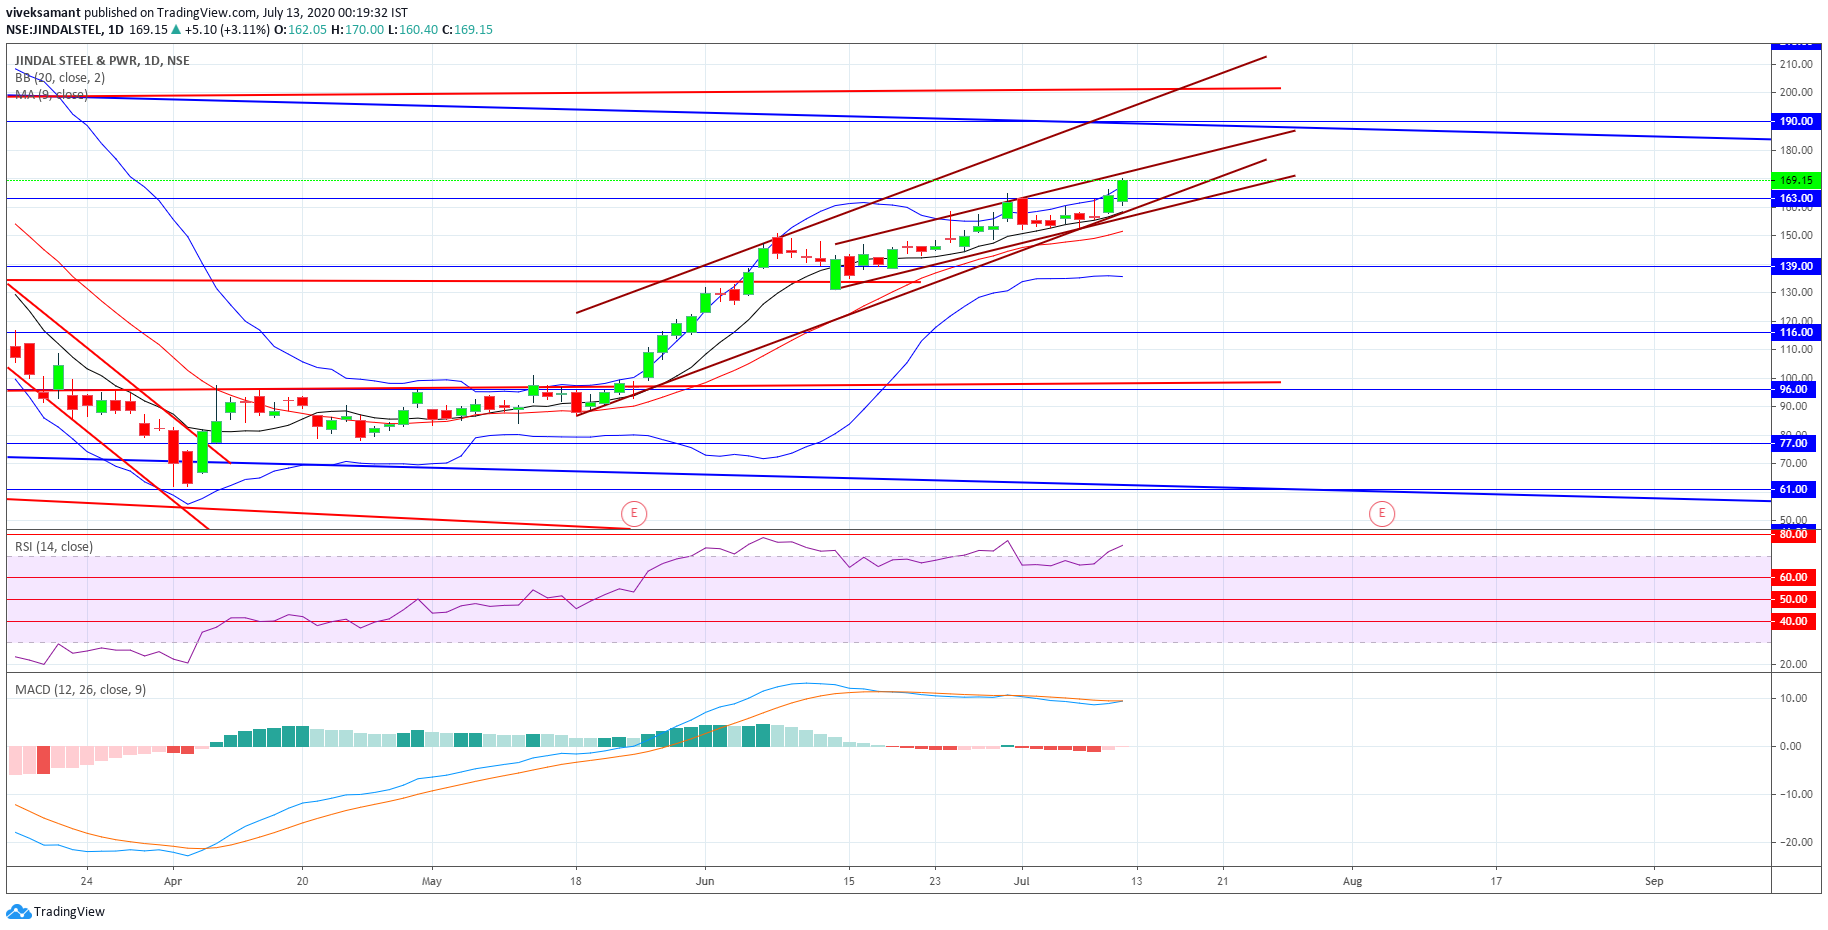
Bullish Stocks to watch for Week Jul-13-17, 2020
Ninad
Lesson Posted on 13/07/2020 Learn Derivatives Trading
BankNifty Update for Jul-13,2020
Ninad
Banknifty did all our targets below 22700 (22500 & 22350). Low made was 22320.


Learn Stock Market Trading from the Best Tutors
Lesson Posted on 10/07/2020 Learn Derivatives Trading
BankNifty Update For Jul-10, 2020
Ninad
Banknifty opened above 22700, our level for long entry and completed target of 22900. It was rangebound throughout the day between 22700 and 22900. Only in the last hour, it moved sharply towards 23000 levels (top made was 22998).

Lesson Posted on 09/07/2020 Learn Derivatives Trading
BankNifty Update For Jul-09,2020 - Weekly Expiry
Ninad
Banknifty opened Gap up @ 22700 and then achieved all our bullish targets of 23900/23000. But the upmove was very choppy and looked like a terminating pattern and was not easy to trade. So I did not take a trade on the upside.


Lesson Posted on 08/07/2020 Learn Derivatives Trading
BankNifty Update for Jul-08,2020
Ninad
Banknifty gave first trade today. It corrected on the downside in the first hour and consolidated for the next 2 hours before it gave sharp upmove and completed our targets of 22450/22550 and almost done 22700 (top made today was 22674).


Learn Stock Market Trading from the Best Tutors
Answered on 12/05/2019 Learn Derivatives Trading

Kushal Jain
Tutor
Hi generating monthly income from trading and investing requires discipline and skill.
First of all, create a trading system that has good risk reward and also has decent accuracy.
make sure that out of 10 trades you take using a system at least more than 5 should be in your favour. and Risk reward is greater than 1:1.5
be more discipline and learn to accept mistakes and you will definitely succeed.
We conduct a lot of free seminar on explaining how to create a good system for consistent profit you can contact my team and attend one such free session to learn more.
www.purpletrades.com
I hope this will help you
cheers
read lessUrbanPro.com helps you to connect with the best Stock Market Trading Classes in India. Post Your Requirement today and get connected.
Ask a Question
The best tutors for Stock Market Trading Classes are on UrbanPro

The best Tutors for Stock Market Trading Classes are on UrbanPro


